How to Export Kubernetes Events for Observability and Alerting
Originally appeared on Opsgenie Engineering Blog
In Kubernetes, there are many objects in the core APIs. One of the most overlooked object types is Events, which are reports on the objects in the API Server. Pod started, scheduled, ReplicaSet scaled are informational events, whereas unhealthy nodes, Pod sandbox errors are considered Warning events, which you may want to get alerts when they occur.
Events have a high volume of activity compared to other objects in the Kubernetes. By default, events have a 1-hour life span and a separate etcd cluster is recommended to ensure scalability. Combined with the inability to search or aggregate, events on their own might not be very useful unless they are exported to external systems. Therefore, we created an open-source project, Kubernetes Event Exporter which watches the events and exports to many systems such as Opsgenie, Elasticsearch, Slack or plain webhooks. We also presented this tool on KubeCon North America 2019 and got a warm response from the community and had great feedback.
When using kubectl describe to get formatted information on an object, events regarding this object is also shown. To be more specific, when you hit kubectl describe my-pod, you will probably see event messages such as Created Container, Pulled the image, Assigned Pod to Node X. You can also see warning events when your Pod has been killed, sandbox changed, has unbound volumes. There are many frequently published informational events. However, there are also some infrequent warning events you might want to be noticed.
Events in Kubernetes are structured objects with the following fields:
- Message: A human-readable description of the status of this operation
- Involved Object: The object that this event is about, like Pod, Deployment, Node, etc.
- Reason: Short, machine-understandable string, in other words: Enum
- Source: The component reporting this event, short machine-understandable string. i.e kube-scheduler
- Type: Currently holds only Normal & Warning, but custom types can be given if desired.
- Count: The number of times the event has occurred
Our open-source tool has a configuration language to filter the events and route them to the various outputs. As a starting point, one can export all the events to Elasticsearch or other analytics tools to see what kind of events are thrown. Counting the events by the reason string can give information about the distribution of the events. There are many hidden data in those events that you can convert to actionable observability. For instance, in one of our development clusters, the workloads are not stable and they are causing generally warning events. In another cluster where we run more stable workloads, the events are regular pod creation, image pull events with some minor warning events. The following is the visualization of events that occurred in those 2 clusters in the 7-day period, grouped by Reason field:
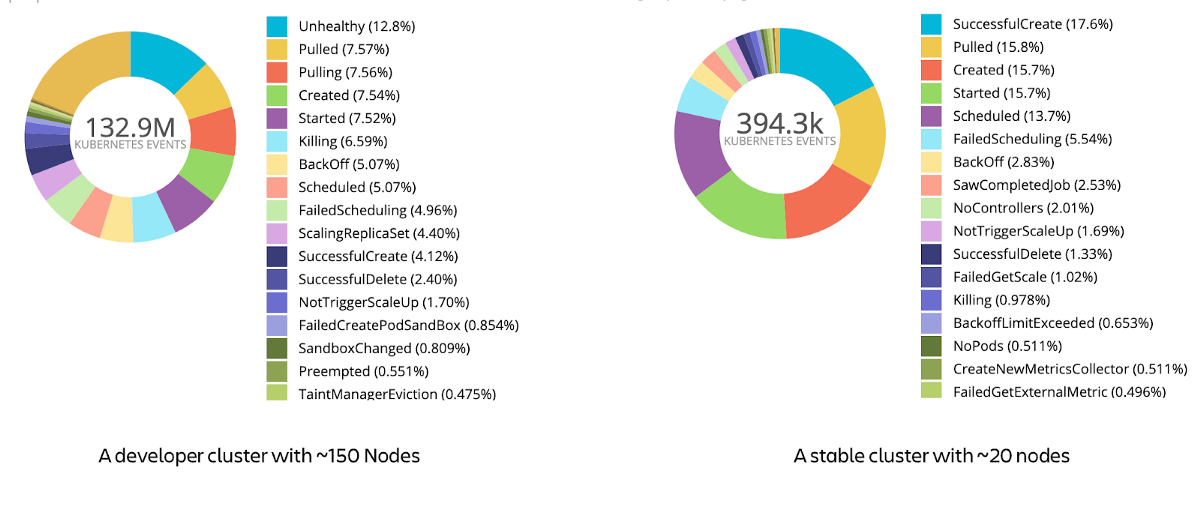 A comparison of event reason distributions for a stable cluster and development cluster
Also plotting out the events as a time-series chart can also be helpful to see trends. For instance, in our clusters, we have cluster autoscaler enabled. In the development cluster, as the workloads live only for minutes, there can be some scheduling problems due to the lack of capacity. If we plot pod creation and schedule fails on the same graph, we see that they are correlated and it has a weekly trend as the devs start working.
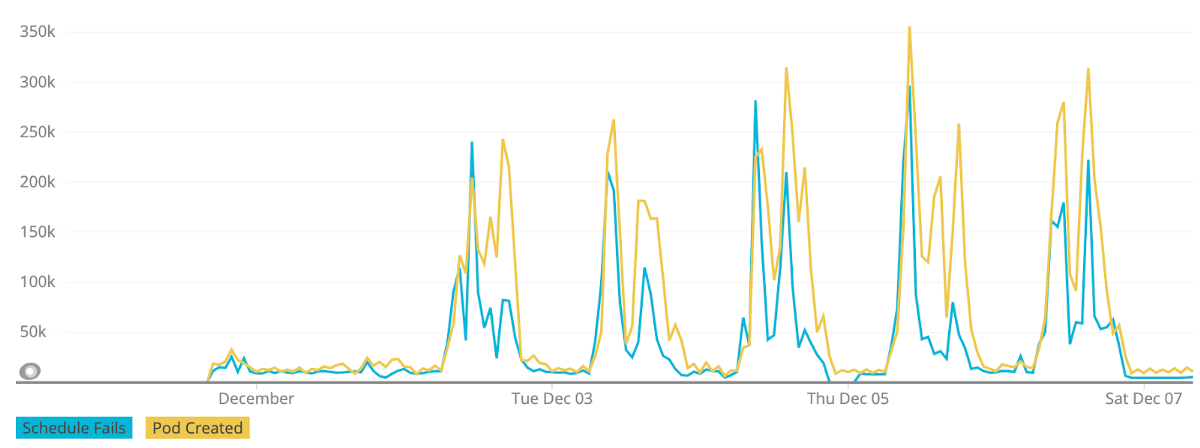 Timeseries view for over a week for finding out Pod Creation counts and Schedule Fails in the development cluster
After you have an idea of what types of events are thrown and decide which are important, you can try creating alerts or Slack notifications. For instance, a Warning event on kube-system namespace can create an alert on Opsgenie so that you are aware of the problems in the critical components. Our tool also fetches the labels on the involved object, so if your objects have owner information in their labels, you can directly notify them via Slack. The configuration of our tool allows creating a routing tree for filtering the events to be received in multiple outputs. With a single configuration and running instance, you can direct the events for both dumping and alerting purposes. The configuration language is slightly inspired by the Prometheus Alert manager.
The first part of the configuration is about routing the events. An example configuration is as follows:
route:
  # Main route
  routes:
    # This route allows dumping all events because it has no fields to match and no drop rules.
    - match:
      - receiver: dump
    # This starts another route, drops all the events in *test* namespaces and Normal events
    # for capturing critical events
    - drop:
      - namespace: "*test*"
      - type: "Normal"
      match:
      - receiver: "critical-events-queue"
    # This a final route for user messages
    - match:
        kind: "Pod|Deployment|ReplicaSet"
        labels:
          version: "dev"
        receiver: "slack"
receivers:
After creating your routing tree, you should also define the receivers. Each receiver has a name and can be configured with a different kind of integration. Currently, the tool supports Elasticsearch, Opsgenie, Webhooks, Slack and AWS SNS, SQS, Kinesis, with more to come in the following days. Output configurations also allow payload customization with Go templating. This allows integrating with external systems that require data to be in a certain format and saves the user from writing additional code.
An example output is configured as follows:
receivers:
  - name: "alerts"
    opsgenie:
      apiKey: xxx
      priority: "P3"
      message: "Event {{ .Reason }} for {{ .InvolvedObject.Namespace }}/{{ .InvolvedObject.Name }} on K8s cluster"
      alias: "{{ .UID }}"
      description: "<pre>{{ toPrettyJson . }}</pre>"
      tags:
        - "event"
        - "{{ .Reason }}"
        - "{{ .InvolvedObject.Kind }}"
        - "{{ .InvolvedObject.Name }}"
If you would like to test the tool, you should head out to the GitHub repository and see the section on deployment. The tool is configured via ConfigMap and runs as a single pod Deployment in Kubernetes. We would also love contributions from you and please have a look at the open issues for a starting point. We hope this tool can give you more observability on your Kubernetes clusters and you can create useful alerts to reduce the incidents and response time!
We have more projects to open source soon, the biggest one is our alternative Kubernetes Dashboard!